Screenshots and Animations

Screenshots


Screenshots from GPlates 1.4.0 (April 2014):
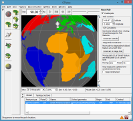
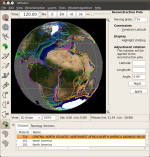
Screenshot thumbnail: GPlates_1_4_move_pole_tool.png The new Move Pole canvas tool. Here the Constrain to Stage Pole button has placed the pole location (white arrow in screenshot) at the stage pole between South America (the clicked feature) and Africa. Subsequently switching to the Modify Reconstruction Pole tool would then result in rotations adjustments about this pole.
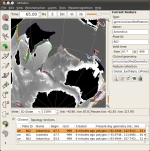
Screenshot thumbnail: GPlates_1_4_export_numerical_rasters.png Here numerical (floating-point) reconstructed rasters are being exported to GeoTIFF file format with a 6 minute (or 0.1 degree) grid resolution. Both the exported geographical region and grid resolution are user-controllable, and together determine the pixel resolution.
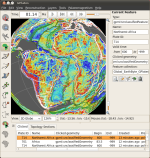
Screenshot thumbnail: GPlates_1_4_velocity_smoothing.png Velocities smoothed across a plate boundary avoid abrupt changes in nearby plate velocities.

Screenshots from GPlates 1.3.0 (May 2013):

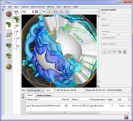
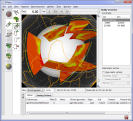
Screenshot thumbnail: GPlates_MantleTemperature_isosurface_walls_deviation.png Mantle temperature isosurface with semi-transparent deviation window. The surface mask includes the entire surface of the globe except the Eurasian plate. The polygon walls show isolines where the isosurface and its two deviation isosurfaces intersect the wall.
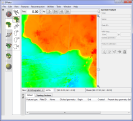
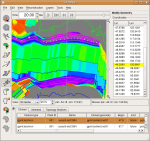
Screenshot thumbnail: GPlates_MantleTemperature_cross_section_isovalue_colour.png Cross sections through the mantle temperature scalar field coloured by isovalue (temperature) with topological plate boundaries overlaid on top. Cooler sections show up as green/yellow and highlight subducting plates.
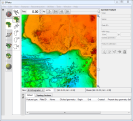
Screenshot thumbnail: Gebco.png The General Bathymetric Chart of the Ocean (GEBCO) raster.
Screenshot thumbnail: GebcoWithGebcoReliefLighting.png Surface relief shaded of the General Bathymetric Chart of the Ocean (GEBCO) raster using itself as the relief map.

Screenshots from GPlates 1.2.0 (January 2012):

Screenshot thumbnail: WorldTopoBathyReconstructedInMapViewWithSmallCircle.png This screenshot shows a map view of the classic "Blue Marble" bathymetry and topography raster reconstructed using present day static polygons and an age grid. Also shown is the Small Circle tool being used to create small circle features.

Screenshots from GPlates 1.1.0 (May 2011):

Screenshot thumbnail: FugroTellusBasins.png The Fugro Tellus Basins dataset, visualised in GPlates with the new Filled Polygons layer option.
Screenshot thumbnail: ReconstructedBasinsAndTopo.png Using the cookie-cutter tool, GPlates can assign Plate IDs to the Fugro Tellus Basins dataset, and display them along with a reconstructed topography raster.

Screenshots from GPlates 1.0.0 (Dec 2010):
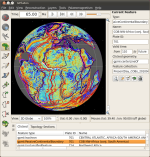
Screenshot thumbnail: Gravity at 65Ma The GPlates 1.0 main window, shown here with a gravity grid reconstructed to 65 Ma.
Screenshot thumbnail: Flowlines GPlates 1.0 includes the ability to create flowlines and motion paths, making it easy to visualise the movement of individual points along a plate.
Screenshot thumbnail: Dynamic Topography GPlates 1.0 displaying vector feature geometry overlaid on Bernhard Steinberger's time-dependent dynamic topography raster images, included in the data bundle available for download.
Screenshot thumbnail: Text Overlay on Rectangular Projection GPlates 1.0 can overlay text on the main viewport along with the current reconstruction time, shown here with the rectangular projection.
Screenshot thumbnail: Small Circles GPlates 1.0 includes the Small Circle tool, allowing the user to add small circle annotations to the globe and visualise stage poles.

Screenshots from GPlates 0.9.10 (Aug 2010):

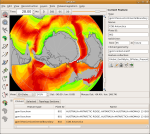
Screenshot thumbnail: Reconstruction the Blue Marble Raster GPlates can now reconstruct rasters! With application of a present-day plate polygon set and age grid, this screenshot shows the classic "Blue Marble" bathymetry and topography raster reconstructed to 120 Ma.
Screenshot thumbnail: Reconstructing Rasters - Bathymetry Here a greyscale Bathymetry grid has been reconstructed.
Screenshot thumbnail: Reconstructing Rasters - Gravity This is the Gravity grid from the sample data, with the static plate polygon set in dark green and coastlines outlined in white.
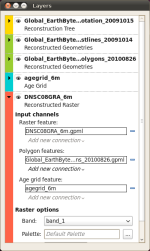
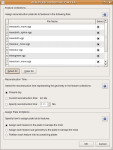
Screenshot thumbnail: Layers Window The new Layers window controls all the new raster functionality. Multiple raster files can be loaded simultaneously, and the user is able to configure the connections between feature collections - such as which plate polygon data should be used to mask and reconstruct which raster file.
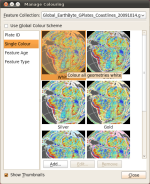
Screenshot thumbnail: ManageColouring.png With all the new raster support, it becomes even more important to be able to choose a complimentary colour scheme for feature geometries.

Screenshots from GPlates 0.9.9 (Jun 2010):

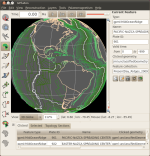
Screenshot thumbnail: New colour scheme in the main window Feature colouring has been overhauled, and many new alternative colour schemes are now possible.
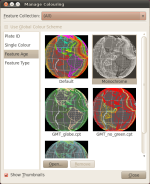
Screenshot thumbnail: New colouring options dialog Colouring options in GPlates can now be managed from this dialog, complete with preview images reflecting what the currently-loaded data would look like with each colour scheme. There are four broad categories of colouring style: By Plate ID, a single colour, by Feature Age and by Feature Type. These can be combined across different feature collections to tailor to each user's needs.
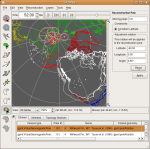
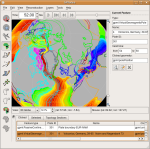
Screenshot thumbnail: VGP Reconstruction Manipulating the reconstruction tree interactively while displaying reconstructed virtual geomagnetic pole positions.
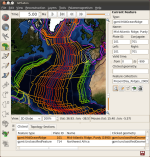
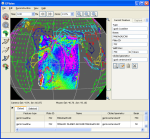
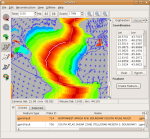
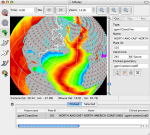
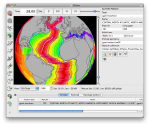
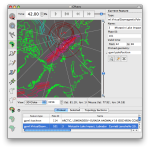
Screenshot thumbnail: Isochrons in the North Atlantic GPlates on OS X inspecting an isochron in the North Atlantic.
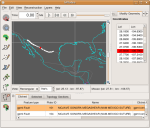
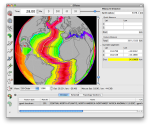
Screenshot thumbnail: Isochrons in the North Atlantic Switching to the Measure Distance tool on the same isochron shows the length along the feature.
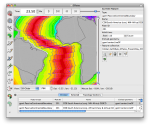
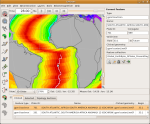
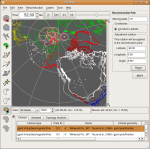
Screenshot thumbnail: South America COB Zooming in on a Continental-Oceanic Boundary feature for South America.
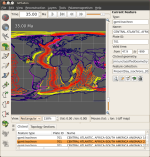
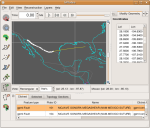
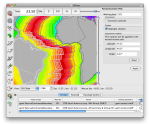
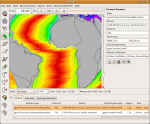
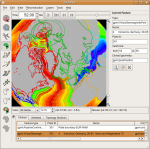
Screenshot thumbnail: South America COB Rotation Switching to the Modify Reconstruction Pole tool highlights all features with the same Plate ID, and allows a quick fine-tuning of the rotation model.
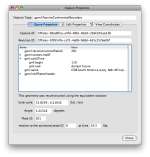
Screenshot thumbnail: South America COB Opening the Feature Properties dialog reveals further detail about the selected COB.
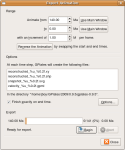
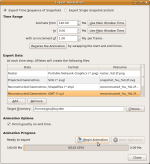
Screenshot thumbnail: Export Animation dialog The Export Animation dialog has been updated to be a more generic Export dialog, and the functionality for exporting single snapshots of views and data are now accessible from the one dialog.
Screenshot thumbnail: South America Isochron Feature An isochron in the South Atlantic between Africa and South America. A colour scheme has been chosen that matches the background raster, while keeping coastlines in dark colours.
Screenshot thumbnail: Africa COB Feature Choosing a Continental-Oceanic Boundary feature - Note how in this screenshot, two possible 'hits' were under the mouse cursor at the time. GPlates makes it easy to disambiguate between close matches like this via the Clicked Feature Table at the bottom of the screen.
Screenshot thumbnail: Antarctica COB Feature Viewing Antarctica - again, multiple features that are nearby the click point are displayed in the table for easy selection.

Screenshots from GPlates 0.9.8 (Dec 2009):

Screenshot thumbnail: Assigning Plate IDs to data When loading data without any Plate ID information, GPlates will open this dialog which allows the user to assign Plate IDs based on closed topological plate polygons. Here we are loading Virtual Geomagnetic Pole data and assigning each pole to a plate based on the dynamic plate polygon that contains the sample point of the VGP.
Screenshot thumbnail: Colouring by the new Plate ID colour scheme Inspecting Virtual Geomagnetic Poles, using the new default Plate ID colouring scheme.
Screenshot thumbnail: Colouring by the new Regional colour scheme Inspecting Virtual Geomagnetic Poles, using the new Plate ID (Grouped by Region) colouring scheme.
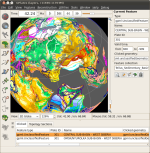
Screenshot thumbnail: GPlates on OS X GPlates on OS X, displaying Virtual Geomagnetic Pole data and colouring by age.
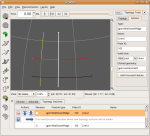
Screenshot thumbnail: Using the new Constrain Latitude option Using the new Constrain Latitude option on the Pole Manipulation tool.

Screenshots from GPlates 0.9.7.1 (Oct 2009):

Screenshot thumbnail: Modifying the geometry of an isochon Modifying the geometry of an isochron at 20Ma, with a background raster image showing spreading rate.
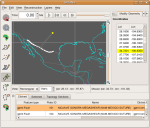
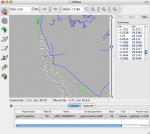
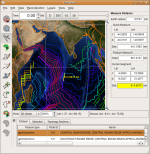
Screenshot thumbnail: Measure Distance tool Using the new Measure Distance tool to measure a segment of an isochron feature.
Screenshot thumbnail: Isochrons in the central atlantic GPlates displaying isochrons in the central atlantic, with the sea-floor age raster image in the background.

Screenshots from GPlates 0.9.5 (June 2009):
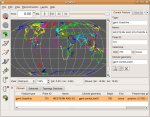
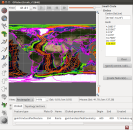
Screenshot thumbnail: the Robinson map projection GPlates is now able to display the Earth in a variety of map projections. Here, the user's view is set to the Robinson projection.
Screenshot thumbnail: a simple topology GPlates now understands time-dependent geometries, which are expressed in terms of topologies, the intersections and connections of other feature geometries. As the reconstruction time is changed, the geometry of the topology varies according to the independent motions of its component geometry sections. An animation of this topology changing shape may be found below in the Animations section.
Screenshot thumbnail: moving a vertex It's now even easier than before to manipulate geometries interactively. When you're deciding which vertex you want to move, each vertex will light up yellow when you pass the mouse pointer over it, and the coordinates of the vertex also light up yellow in the Task Panel. You can move vertices of existing feature geometries or vertices of partially-digitised geometries.
Screenshot thumbnail: extending a polyline You can now insert vertices into the middle of an existing feature geometry, or even extend the feature geometry at either end. If the mouse pointer is over a line-section of the geometry, the line-section will light up, and you can click the mouse button once to insert a new vertex. If the mouse pointer is past either end of the geometry, you can click once to extend the geometry from that end.
Screenshot thumbnail: deleting a vertex You can also delete a vertex from a geometry. The geometry which will be deleted will light up red, and the coordinates of the geometry will also light up red in the Task Panel.
Screenshot thumbnail: Export Animation dialog Animations are no longer just pretty pictures on your screen! The new Export Animation dialog enables you to harness the power of the GPlates reconstruction engine to create your own “data animations”, exporting each frame of a reconstruction animation and saving it to disk in a sequence of files.

Currently, the Export Animation dialog offers the following export functions:
  • all reconstructed feature geometries (as GMT .xy files or Shapefiles)
  • a 2-D vector graphics snapshot of the view (as SVG files)
  • all velocity fields (as GPML files)
More export functions will be added in the future.
Screenshot thumbnail: Reconstruction menu GPlates offers new export functions in the Reconstruction menu.

Screenshots from GPlates 0.9.4 (December 2008):
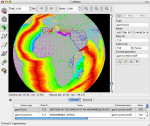
Screenshot thumbnail: GPlates on OS X The main GPlates window on MacOS X, with the the global coastline file and the time-dependent ocean floor-age raster image sequence loaded.
Screenshot thumbnail: a raster of non-global extent GPlates is now able to display raster images which do not cover the whole globe. The desired surface extent of the raster may be specified, enabling rasters of a smaller size to be correctly sized and positioned. This screenshot was taken on Windows, using an image cropped from the free air gravity anomaly map created at NGU.
Screenshot thumbnail: dynamic topography raster at 55 Ma The main GPlates window on Linux, displaying Bernhard Steinberger's time-dependent dynamic topography raster image sequence at a reconstruction time of 55 Ma (55 million years ago).
Screenshot thumbnail: Manage Feature Collections dialog The updated Manage Feature Collections dialog offers the ability to reload a file from disk with a single click, as well as the ability to enable or disable a feature collection without unloading or reloading the file.
Screenshot thumbnail: moving the vertices of a geometry GPlates enables geometries to be modified interactively by dragging the vertices.
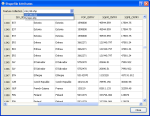
Screenshot thumbnail: table of Shapefile attributes The attributes in a Shapefile may be viewed in a compact tabular (spreadsheet-like) format, with one attribute per column. The Shapefile shown is a sample Shapefile distributed by ESRI.
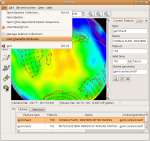
Screenshot thumbnail: File menu The Manage Feature Collections dialog and Shapefile Attributes dialog are both accessed through the GPlates File menu.

Screenshots from GPlates 0.9.3.1 (October 2008):
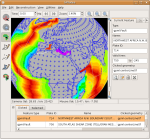
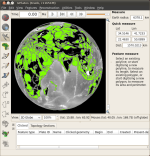
Screenshot thumbnail: main window with ocean floor-age texture loaded The main GPlates window, with the the ocean floor-age texture loaded.
Screenshot thumbnail: colouring-schemes for features GPlates offers a variety of colouring-schemes for feature geometries on-screen.
Screenshot thumbnail: digitising a feature geometry GPlates enables interactive digitisation of point, polyline and polygon geometries for the creation of new features.
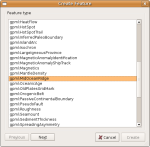
Screenshot thumbnail: Create Feature dialog After you have digitised a new feature geometry, GPlates offers a variety of GPML feature-types from which to choose.
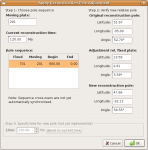
Screenshot thumbnail: modification of a reconstruction pole GPlates enables interactive, graphical modification of the total reconstruction poles (finite rotations) which are used to reconstruct features. After you have dragged a plate into a new position on-screen, GPlates calculates the new reconstruction pole for that plate at that time.
Screenshot thumbnail: preview of GPlates on MacOS X A preview of GPlates on MacOS X.

Screenshots from GPlates 0.9.2 (May 2008):

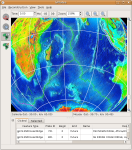
Screenshot thumbnail: EarthByte coastlines and a NASA topo-bathy image The main GPlates window, with the EarthByte global coastline file and a NASA world-topo-bathy image loaded.
Screenshot thumbnail: Plate-boundaries and an elevation raster The main GPlates window, with plate-boundary features and a global elevation raster image loaded.
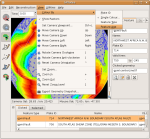
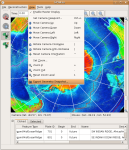
Screenshot thumbnail: View menu The operations in the View menu, which are used to: control the camera position, orientation and zoom; toggle the display of rasters on the globe; and export a snapshot of the geometries on the 3-D globe as a 2-D vector-graphic image.

Note that the mouse can also be used to re-position the camera (using the “Drag globe to re-orient” tool) and change the zoom (using the scroll wheel).
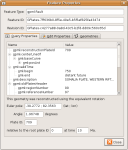
Screenshot thumbnail: Query Feature Properties dialog Querying the properties (also known as “attributes” in some GIS software) of a feature.

The feature-types used in GPlates are defined by the GPlates Geological Information model.
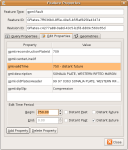
Screenshot thumbnail: Edit Feature Properties dialog Editing the properties of a feature.

GPlates uses a custom-designed “widget” (user-interface element) for each type of property, enabling property values to be edited in a convenient, easy-to-use fashion.
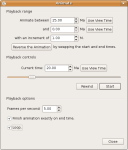
Screenshot thumbnail: Animate dialog The Animate dialog is used to animate a reconstruction between user-specified start and end times.
Screenshot thumbnail: Total Reconstruction Poles dialog, Relative Rotations tab The Total Reconstruction Poles dialog provides a variety of informative representations of the total reconstruction poles (finite rotations) for the current reconstruction time. The Relative Rotations tab contains a table of relative rotations for each moving plate ID.

It is also possible to export the table of total reconstruction poles in CSV (comma-separated value) format, for later viewing in a spreadsheet such as Microsoft Excel.
Screenshot thumbnail: Total Reconstruction Poles dialog, Reconstruction Tree tab The Reconstruction Tree tab of the Total Reconstruction Poles dialog contains a tree-like representation of the hierarchy of relative rotations at the current reconstruction time.

Animations


Animated screenshot from GPlates 0.9.5 (June 2009):

Screenshot thumbnail: A simple topology from the sample-data An animated screen-capture of the main GPlates window, with a simple topology (from the sample-data directory in the GPlates source code) loaded.

You can observe the geometry of the topology (in white) change shape as its component geometry sections (red, red, yellow and blue) are reconstructed independently.

(902 KB animated GIF image)

Animated screenshot from GPlates 0.9.2 (May 2008):
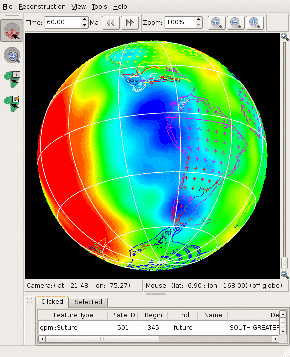
Screenshot thumbnail: Coastlines and a dynamic topography raster An animated screen-capture of the main GPlates window, with the EarthByte global coastline file and Bernhard Steinberger's time-dependent dynamic topography raster images loaded, animating a reconstruction from 60 Ma to 0 Ma.

Observe that even while GPlates is animating the reconstruction and raster images, the program remains fully interactive: During this animation, the user is able to zoom in and out, move the camera by “dragging” the globe, and query a feature.

(14 MB animated GIF image)